Optimize SDR performance
The concept of software defined radio (SDR) has existed for many years. Consequently, you can find many descriptions of an SDR. A concise definition of an SDR is a radio in which some or all of the physical layer functions are software-defined. The physical layer function is the layer within the wireless protocol in which processing of RF, IF, or baseband signals (including channel coding) occurs. Many of today’s SDRs have part of the signal processing implemented in software.
The ability to implement in software numerous waveforms and receiver functions is appealing from the perspective of cost, complexity, programmability, and more. A goal of SDR is to produce an entire radio in software, downconverting the received analog signal to baseband at the antenna port and eliminating much of the hardware in between. Today, SDR is increasingly implemented in both military and commercial networks in more modest ways. The challenge with any SDR design is that it is a complex system that requires analysis from the component through system levels in order to achieve the desired performance. This article explains the attributes of SDR, the design challenges, and it includes hands-on examples of how AWR’s Visual System Simulator (VSS) software for system simulation of RF end-to-end architecture design can be used to address these challenges.
SDR in brief
There are many specific processes that define a radio as an SDR. A modern day cell phone, for example, can be considered an SDR because most (if not all) of the baseband processing is performed by a digital signal processing (DSP) chip. SDRs enable a single transceiver to accommodate many different waveforms, which makes it an essential ingredient in creating, for instance, a universally-compatible nationwide public safety network. SDR has long been attractive to manufacturers, commercial wireless carriers, and the military because it enables a single hardware platform to accommodate a wide array of modulated waveforms by implementing them in software. As a result, it eliminates physical components such as mixers, filters, amplifiers, modulators and demodulators, and detectors. In addition, it creates a multi-mode, multi-band, multi-functional communications platform that can be dynamically programmed locally or remotely to accommodate new waveforms and enhancements to existing ones.
Simulating SDRs
In order to understand and predict the behavior of a particular SDR design, it is necessary to construct the signals per the baseband physical layer specifications, such as WCDMA, WiMAX, or LTE. This requires designers to implement channel coding, interleaving, and pulse shaping. Once these signals are generated, the simulation can be used to determine the impact of impairments on the RF/IF portion of the SDR, making measurements such as error vector magnitude (EVM) or bit error rate (BER) for example. With this information, designers can make trade offs between different components or circuit implementations while injecting interfering signals and adjacent channels into the RF path to simulate a real-world environment.
SDR systems must inherently accommodate a variety of modulation schemes that vary in their complexity within the same system architecture. For instance, higher-order schemes such as 64QAM are used when signal conditions permit in order to deliver higher data rates. So, the impact of an RF link on the BER performance of a 16QAM versus that of a 64QAM signal is important to understand. Unfortunately, understanding the impact that RF impairments have on today’s complex modulated signals is not a straightforward procedure, nor can it be accurately predicted with ‘gut calls’ or back-of-the-envelope calculations.
Critical SDR parameters required in a simulation tool include:
- Modulation accuracy or EVM
- Fixed-point implementation
- ADC/DAC quantization level
- BER performance
- Carrier to noise ratio (CNR)
- Spurious-free dynamic range (SFDR)
- Adjacent channel-power ratio (ACPR)
- Carrier to third-order-intermodulation ratio (C/IM3dBc)
- Spectral mask requirement
Simulation example
In the following example, AWR’s VSS software is used to virtually modify the values of components to achieve optimal results for an SDR receiver designed to capture 16QAM and 64QAM signals. The goal is to use VSS to determine a suitable P1dB for the front-end amplifier as well as a phase noise mask for the local oscillator (LO). Determining a suitable P1dB prevents a device from being driven into compression as well as getting reasonable power added efficiency (PAE). Achieving a tolerable phase-noise level will enable the device to meet BER requirements.


Figure 1 shows the initial 16QAM system. To complete a system analysis, first, the signal characteristics are defined and a swept simulation of signal-to-noise ratio (SNR) versus BER is performed. In this example, the results of the BER simulation shown in Figure 2 (red squares) agree with theory (the black reference curve). Next, a behavioral amplifier model is added to the receive link just after the additive white Gaussian noise (AWGN) channel. This amplifier is used to determine a suitable P1dB to maintain a BER of 10-6 at an SNR of about 20dB (the optimal performance characteristics for this SDR).


The third-order intercept point (IP3) is set to about 10dB above the P1dB point, and amplifier gain is maintained at 10dB. The results of a BER simulation shown in Figure 2A show that with P1dB power of 10dB, a received SNR of about 22dB is required to achieve 10-6 BER. However, if P1dB power is set to 12dB, the desired results are achieved (Figure 2B).
After adding a filter data file to the system just after the amplifier block, it is possible to evaluate BER performance. The 16QAM signal uses a root-raised cosine (RRC), pulse-shaping filter with an alpha of 0.35, and a bandwidth of about 50kHz. The center frequency of the signal is 10MHz. The selected filter has 0dB of attenuation in the passband and a bandwidth of about 52kHz. Attenuation rolls off to about -50dB at 9.9 and 10.1MHz from the center frequency. The 16QAM signal can be detected with the desired BER results. Next, single-sideband (SSB) phase noise of the downconverter is added to the received signal, and it is applied directly to the downconverter’s local oscillator (LO). Performing the simulation in this manner allows direct analysis of the impact of phase noise on BER. The system diagram and the resulting performance with phase noise added are shown in Figure 3. After adding phase noise, the minimum SNR required by the receiver to achieve a BER of 10-6 is about 22dB.

Varying modulation schemes
Recalling once again, SDR systems must inherently accommodate a variety of modulation schemes that vary in their demands and complexity within the same system architecture. Higher-order schemes, such as 64QAM, are employed when signal conditions permit in order to deliver higher data rates. To show the effect of using such modulation techniques, the 16QAM source in the previous example is replaced with a 64QAM source of the same bandwidth and pulse shaping. The software automatically configures the receiver to detect the 64QAM signal. Figure 4 shows the resulting BER simulation with phase noise using 64QAM with the same receiver RF characteristics described in Figure 6. The best achievable BER using 64QAM is 10-3.


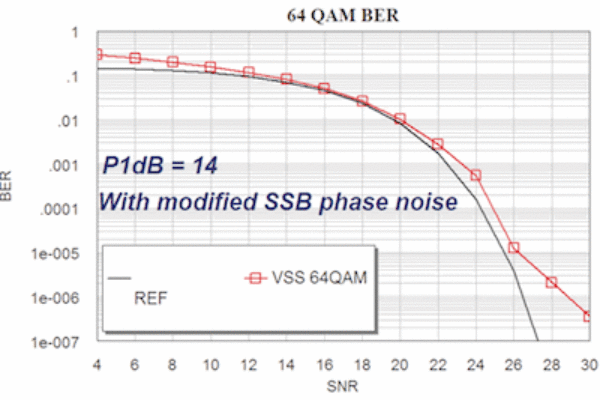
The 64QAM BER results are shown in Figure 5 (with phase noise removed from the equation), which shows that a BER of 10-6 cannot be achieved. By viewing the complementary cumulative distribution function (CCDF) of 16QAM versus 64QAM in Figure 6, the peak-to-average ratio (PAR) of 64QAM exceeds that of 16QAM by about 1dB. To safely compensate for the difference in PAR, the amplifier’s P1dB output is set to 14dB, and the resulting BER simulation (without the effect of phase noise) is shown in Figure 7. Now it is necessary to reintroduce phase noise into the system and to determine how much phase noise can be tolerated while still maintaining a BER of 10-6.

The phase noise data file in VSS software consists of two columns of data. The first column represents offsets in frequency from the carrier (from 10Hz to 1MHz) and the second provides signal levels below that of the carrier. Each frequency point within the range of offsets is 10 times that of the preceding value. At a frequency offset of 10Hz, the phase noise mask is -31.6dBc/Hz, and at a 1MHz offset is -141.8dBc/Hz. To accommodate 64QAM, the phase noise values of the data file were decreased by 9dB. The results in Figure 8, using modified phase noise data, show that with an SNR of 28.5dB a 10-6 BER can be achieved. Figure 9 shows the received IQ plot at an SNR of 30dB, which identifies a small amount of phase-noise-induced jitter that produces errors. The 16QAM BER simulation results using a modified phase-noise mask indicated that 10-6 BER can be achieved with an SNR of about 21dB.


Importance of versatility
Simulation software such as VSS can be used to evaluate complex SDR receivers that must process the simplest FM waveforms as well as higher-order modulation schemes of 64QAM. Fortunately, in addition to the example above, it is possible to identify other potential signal-degrading factors, such as IQ imbalance, and the impact of interfering signals on BER. Complex communications systems require analysis at all levels of the design process in order to achieve desired performance. While the ultimate goal of SDR–to implement the entire radio design in software and minimize the amount of the hardware needed–is still in the future, increased capabilities in simulation solutions is helping the growth of SDR implementations in both military and commercial networks in important ways.
About the Author:
Joel Kirshman is an applications specialist in AWR’s Visual System Simulator software and has been with the company for more than a decade. Prior to joining AWR, Joel worked for Elanix in a similar role as a system simulation expert.
Joel holds a master degree in electrical engineering from California State University, Northridge. Prior to entering the EDA industry, Joel spent a number of years at The Aerospace Corporation where he worked on various project from designing a digital processing unit for a space application, to rad-hard testing of electronic devices, and working for the GPS program office.
 If you enjoyed this article, you will like the following ones: don't miss them by subscribing to :
eeNews on Google News


